Firn
Well-known member
- Thread starter
- #1
Hey everyone, we had a great conversation about heater usage the other day, so I thought I’d share my latest findings with you all.
Background:
I’m conducting some specific tests to assess the impact of tire pressure on efficiency (more on that later), and tracking heater usage is a key part of validating my data. Below are my findings so far.
Test Setup:
I drive a consistent highway route, maintaining a steady 70mph with cruise control (non-ACC) engaged, interior temp set to my normal 70 degrees. I’ve completed the route four times now. While I’ve tried to keep external temperature and wind speed as consistent as possible, there’s about a 12°F difference between my warmest and coldest test days. Plus side, we can see how the heater responds to different temps.
Results:
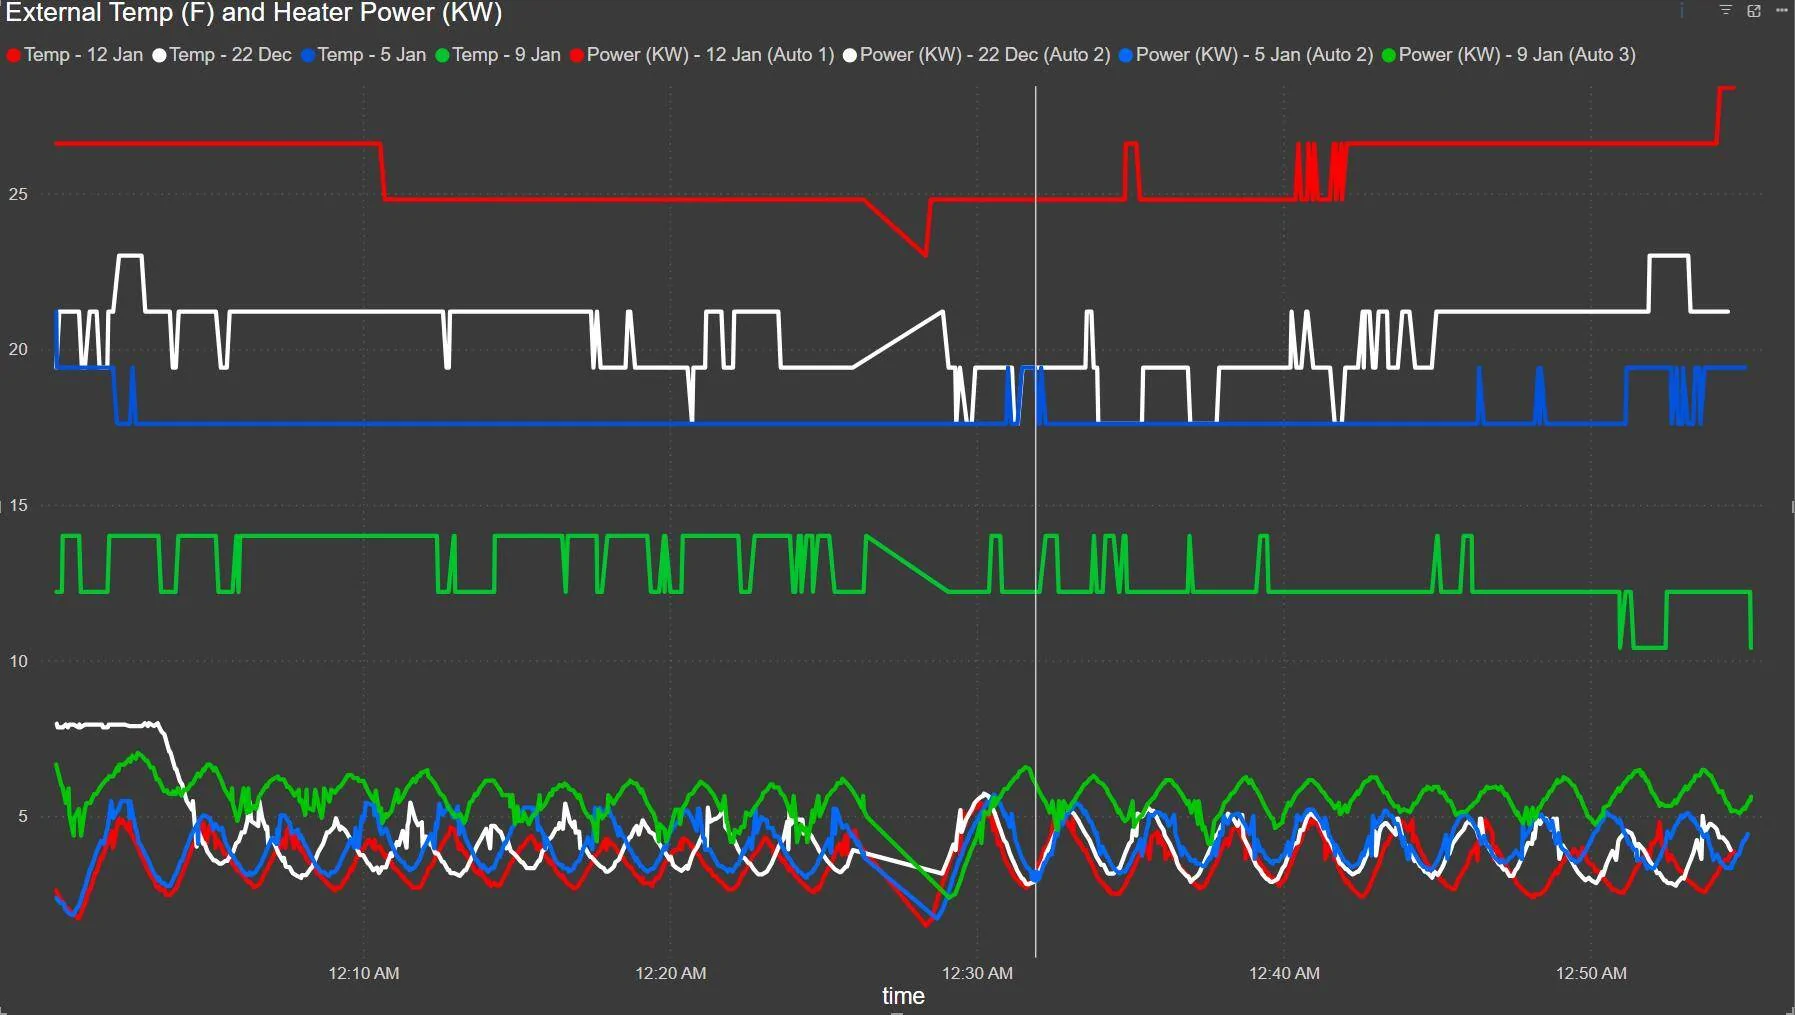
The exterior temperatures, as reported by the truck, are shown on the upper four lines of the chart, with coolant heater power usage overlapping on the lower section.

Note: This is my first attempt at using Microsoft Power BI, so I’m still refining the visuals.
Here are the average heater power usage figures for each day I tested. Averaging period is ~52 minutes.
Observations:
I’ll continue testing and refining the data. If anyone has additional insights or suggestions, feel free to chime in!
Background:
I’m conducting some specific tests to assess the impact of tire pressure on efficiency (more on that later), and tracking heater usage is a key part of validating my data. Below are my findings so far.
Test Setup:
I drive a consistent highway route, maintaining a steady 70mph with cruise control (non-ACC) engaged, interior temp set to my normal 70 degrees. I’ve completed the route four times now. While I’ve tried to keep external temperature and wind speed as consistent as possible, there’s about a 12°F difference between my warmest and coldest test days. Plus side, we can see how the heater responds to different temps.
Results:
The exterior temperatures, as reported by the truck, are shown on the upper four lines of the chart, with coolant heater power usage overlapping on the lower section.

Note: This is my first attempt at using Microsoft Power BI, so I’m still refining the visuals.
Here are the average heater power usage figures for each day I tested. Averaging period is ~52 minutes.
- 12 Jan: 3.49 kW
- 22 Dec: 4.34 kW
- 5 Jan: 4.11 kW
- 9 Jan: 5.56 kW
Observations:
- I’ve noticed that using the HVAC on Auto 3 setting seems to increase power usage. Not only is the power consumption higher, but the cabin also feels warmer.
- Each test begins a few miles from my home. The truck is garage-kept and typically starts around 55°F when I get in.
- I haven’t observed the heater using any power to warm or maintain the battery temperature (there’s a specific PID for that).
- On 22 Dec, the higher power usage at the beginning of the test was due to the HVAC being off at home, and then turning it on shortly before starting the trip. The system was still warming up the cabin at the start of the test.
I’ll continue testing and refining the data. If anyone has additional insights or suggestions, feel free to chime in!
Sponsored


