Sponsored

How pessimistic is the Mi/kWh display on the dash?

TaxmanHog

Moderator
Moderator
First Name
Noel
Joined
Jan 19, 2022
Threads
171
Messages
12,341
Reaction score
13,004
Location
SE. Mass.
Vehicles
2022 Lightning Lariat-ER Max Tow & 2024 Harley-Davidson Road Glide CVO-ST
Occupation
Retired
The issue is the tenth of an MPK between the IPC & the Sync screen, that simple.

We've beat the BMS theory to death in other threads and BTW to OP, we've also discussed at the tenth issue in other threads.
Sponsored

 
OP
OP

GoHawks

Well-known member
Joined
Jan 7, 2023
Threads
14
Messages
69
Reaction score
65
Location
PNW
Vehicles
2022 Lariat Lightning ER
I appreciate the insights. I had never noticed the discrepancy before and generally rely on dash display vs the 15” screen display. Realizing potential different inputs and different calculations depending on the owner of that feature implementation is the most likely the cause between the display differences. I had not run across that discussion in the forum prior. I also understand the ‘energy’ held or used by the battery differs depending on a lot of variables (temperature, etc.) and could affect the results.

Has anyone ever done a deeper dive into how pessimistic the mi/kWh display is? I understand it is an average, but using accurate kWh consumed (start and end value) during a trip divided by miles driven? Is the average display very close, generally under by x% or variable both + and - depending on the day.

I am happy to let the thread die, but was generally curious and differing display values made me think a little bit more about the topic.
 

TaxmanHog

Moderator
Moderator
First Name
Noel
Joined
Jan 19, 2022
Threads
171
Messages
12,341
Reaction score
13,004
Location
SE. Mass.
Vehicles
2022 Lightning Lariat-ER Max Tow & 2024 Harley-Davidson Road Glide CVO-ST
Occupation
Retired
I always use the pessimistic value for my on the fly computations & validation of progress, better safety margin for long runs and running your SOC low.
 

mb0220

Well-known member
First Name
Matt
Joined
Jan 10, 2023
Threads
5
Messages
178
Reaction score
145
Location
Oregon
Vehicles
2022 Lariat ER
In my experience, the mi/kWh is pretty bang-on accurate. What conerns me is that the GoM is ALWAYS optimistic. I do understand the inherent flaws in the GoM and I definitely don't live my life by it. I just expected that the inaccuracy should spread somewhat evenly between the high side and the low side.
 

HHI-Lightning

Active member
First Name
Rick
Joined
Apr 30, 2024
Threads
0
Messages
29
Reaction score
27
Location
South Carolina
Vehicles
F-150 Lightning Lariat ER
@mb0220 - that’s the exact opposite of my observations.

Just drove 350 miles yesterday with my ‘23 Lariat ER. Flat Interstate driving, I-95 thru North and South Carolina. Cruise set at 65 the entire duration. Temps 66-75. No notable wind or adverse weather

Mi/KwH shown on display was about 7-8% under reported. (Display showing 2.1 when actual was about 2.3)

GOM is always significantly Pessimistic on available range. Charged to 80% at DCFC, GOM shows range of 180 miles. Actual range should have shown as 240 miles.

I find in flat highway driving, keeping speed in the 65 - 70 mph range, 65 - 75 degrees outside, normal wind, I can consistently get 30 actual miles out of each 10% of the ER battery.

10% of 131 KwH = 13.1. 30 miles / 13.1 =2.29 miles / KwH
 

Sponsored

Zprime29

Well-known member
First Name
Brandon
Joined
Jul 26, 2022
Threads
37
Messages
1,981
Reaction score
2,071
Location
Tucson, AZ
Vehicles
Honda Pilot, 2022 Lightning ER
@mb0220 - that’s the exact opposite of my observations.

Just drove 350 miles yesterday with my ‘23 Lariat ER. Flat Interstate driving, I-95 thru North and South Carolina. Cruise set at 65 the entire duration. Temps 66-75. No notable wind or adverse weather

Mi/KwH shown on display was about 7-8% under reported. (Display showing 2.1 when actual was about 2.3)

GOM is always significantly Pessimistic on available range. Charged to 80% at DCFC, GOM shows range of 180 miles. Actual range should have shown as 240 miles.

I find in flat highway driving, keeping speed in the 65 - 70 mph range, 65 - 75 degrees outside, normal wind, I can consistently get 30 actual miles out of each 10% of the ER battery.

10% of 131 KwH = 13.1. 30 miles / 13.1 =2.29 miles / KwH
That jives with my experience as well. Though it's hard to drive on the slower side for hours at a time. I always end up creeping faster after an hour or two.
 

XENOILPHOBE

Active member
First Name
Greg
Joined
Oct 11, 2024
Threads
1
Messages
31
Reaction score
19
Location
DC Swamp
Vehicles
2024 F-150 Lightning Platinum, 2024 Tesla Model X Plaid, 2024 Model Y AWD
Occupation
Retired Army
The GOM is the ultimate pessimist, on The Hopelessness Scale it gets an "intense hopelessness" rating.

Ford F-150 Lightning How pessimistic is the Mi/kWh display on the dash? 1733107473638-o5


Today I took my truck out at 90% charge and it stated 187 mile of range with an ER battery in my Platinum, temps last night go down to 22 F, so the GOM freaked out. I drove around under 50 miles per hour for about an hour and came home with the GOM at 182 miles of range remaining, after driving 38 miles. :sadface:

My 100% charge can be anywhere from 220 miles to 278 miles of range with 22 inch wheels, depending on if my GOM took it meds. I have never seen the EPA 300 miles of range EVER in 7000 miles of driving. As an owner of 6 Teslas, I have never seen such blatant marketing BS on range. Even Tesla would disclose the impact of larger wheels on range, I don't know who the marketing genius was who decided to put huge wheels on the premium product killing off >40 Miles of range.

I plan to dump these 22 inch wheels, just like I did with 21's on my Teslas and go with 20" inch wheels and better EV rated tires, once I smoke these all seasons off. It also opens up the market to a broader range of tires for the truck.

https://www.f150lightningforum.com/forum/threads/best-wheels-tires-for-efficiency.19311/post-429437
 
Last edited:

Scorpio3d

Well-known member
First Name
Chris
Joined
Mar 18, 2024
Threads
19
Messages
563
Reaction score
637
Location
Texas
Vehicles
2023 Ford F150 Lightning Lariat ER
Occupation
SS/IBA car wash owner
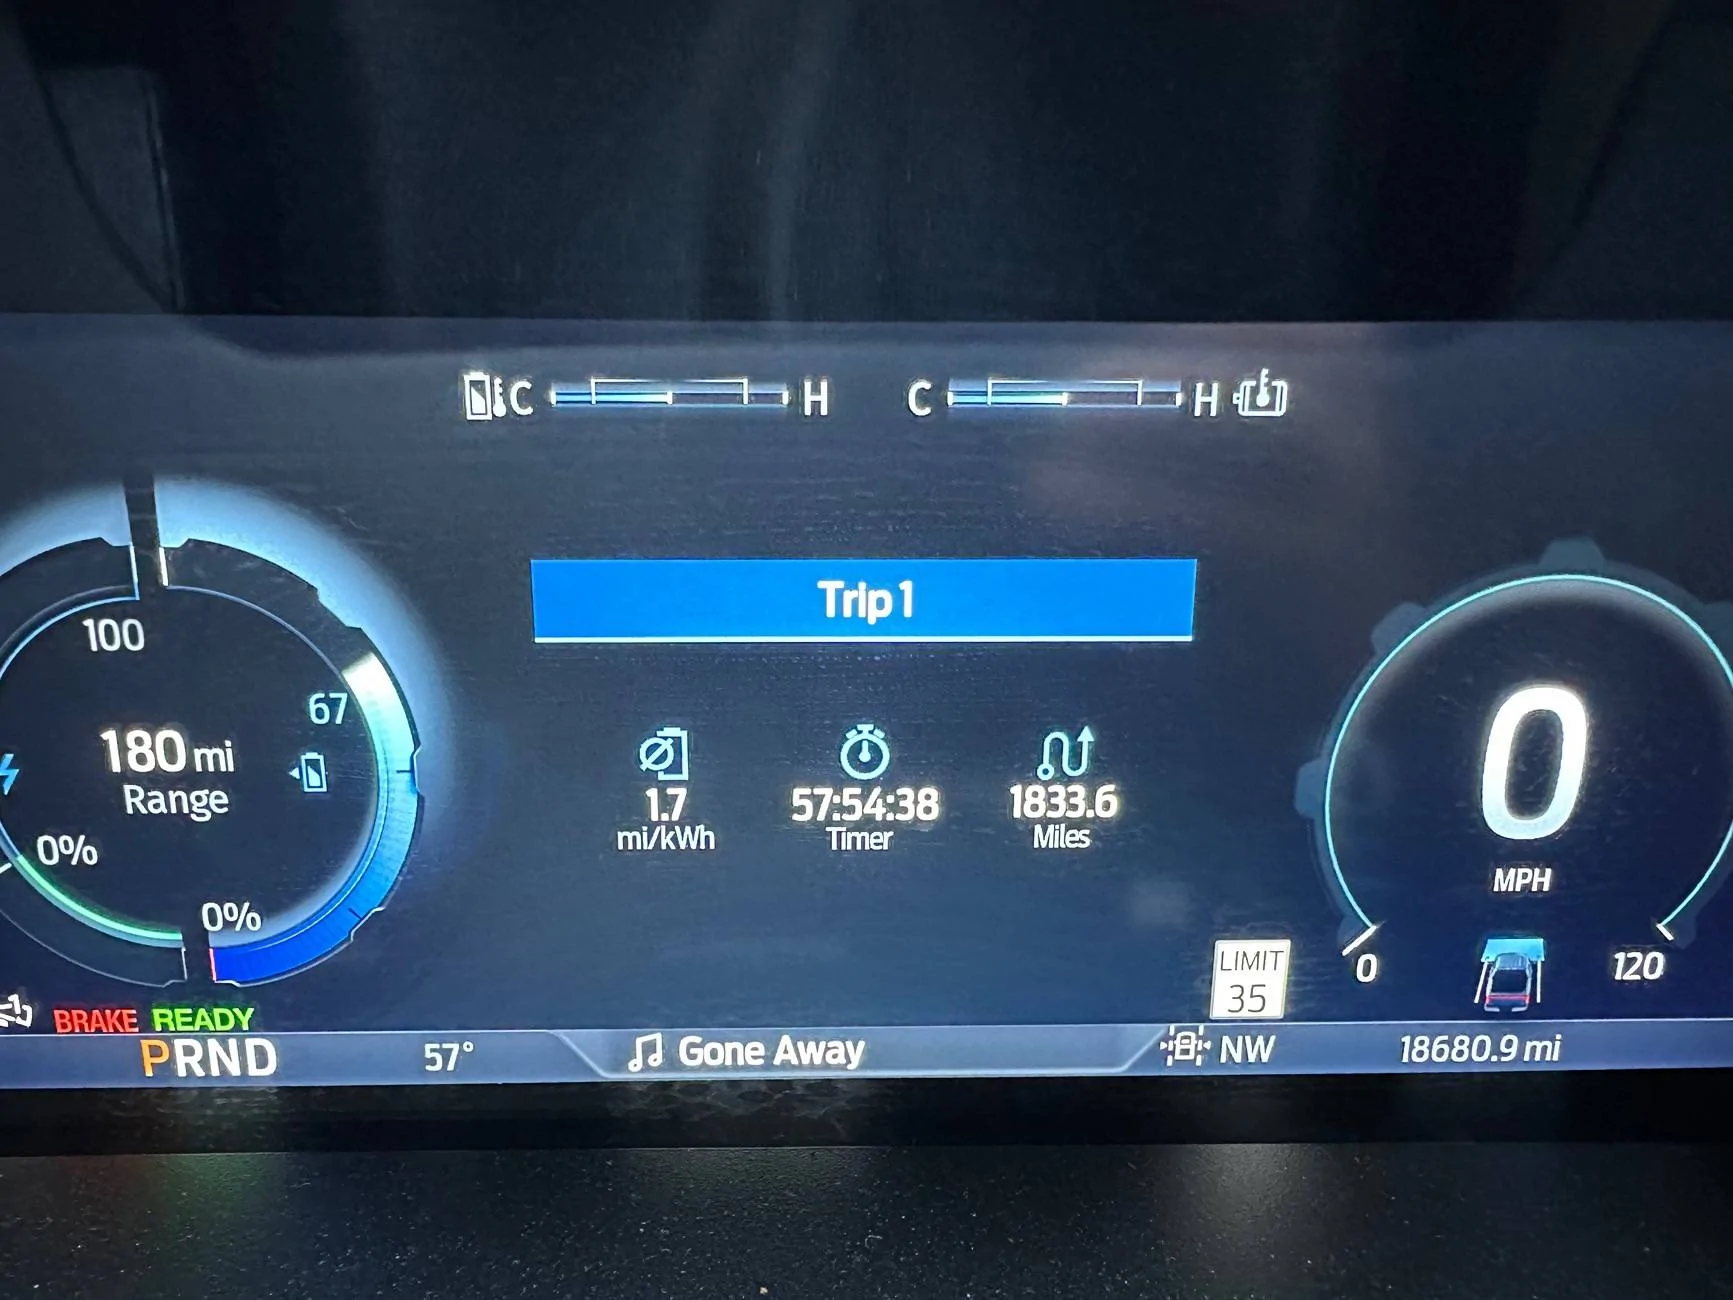
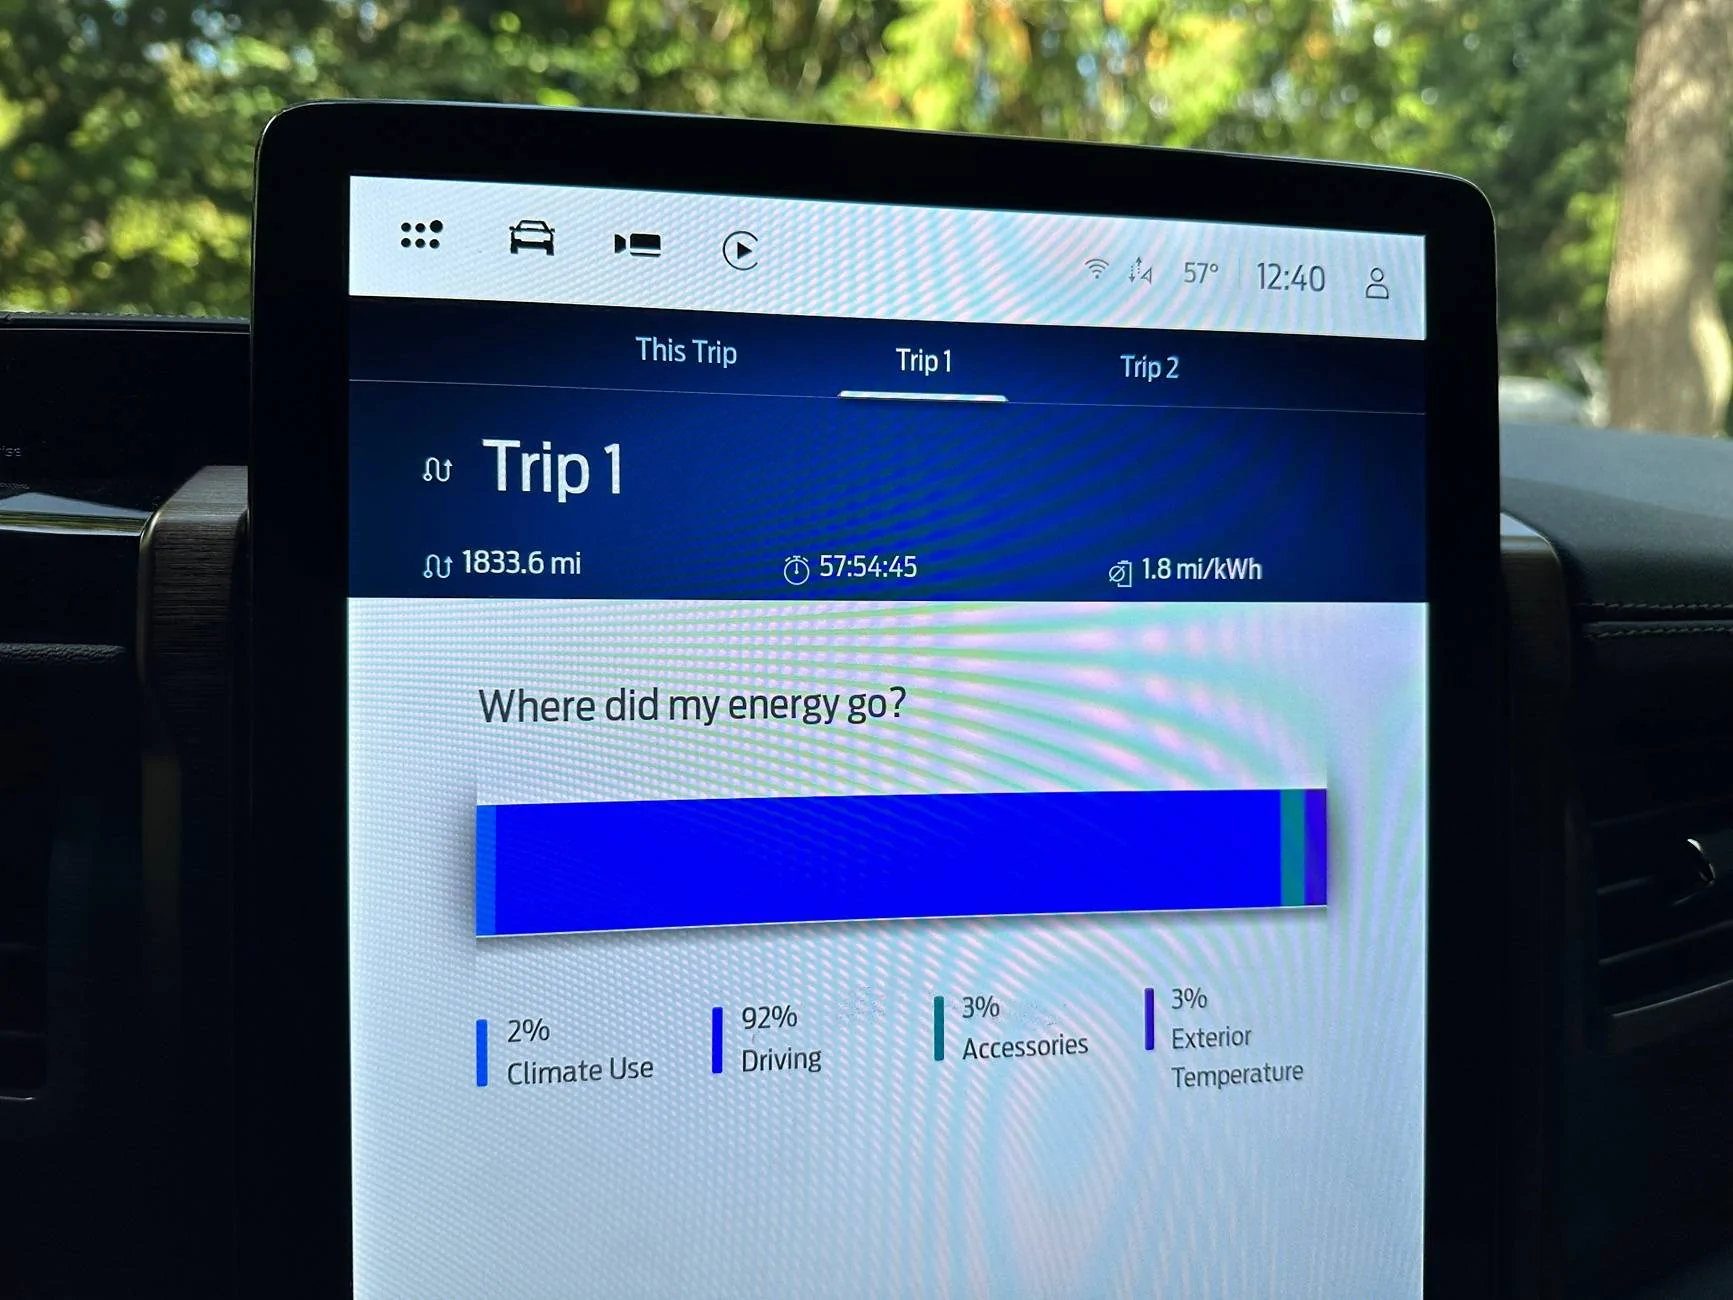
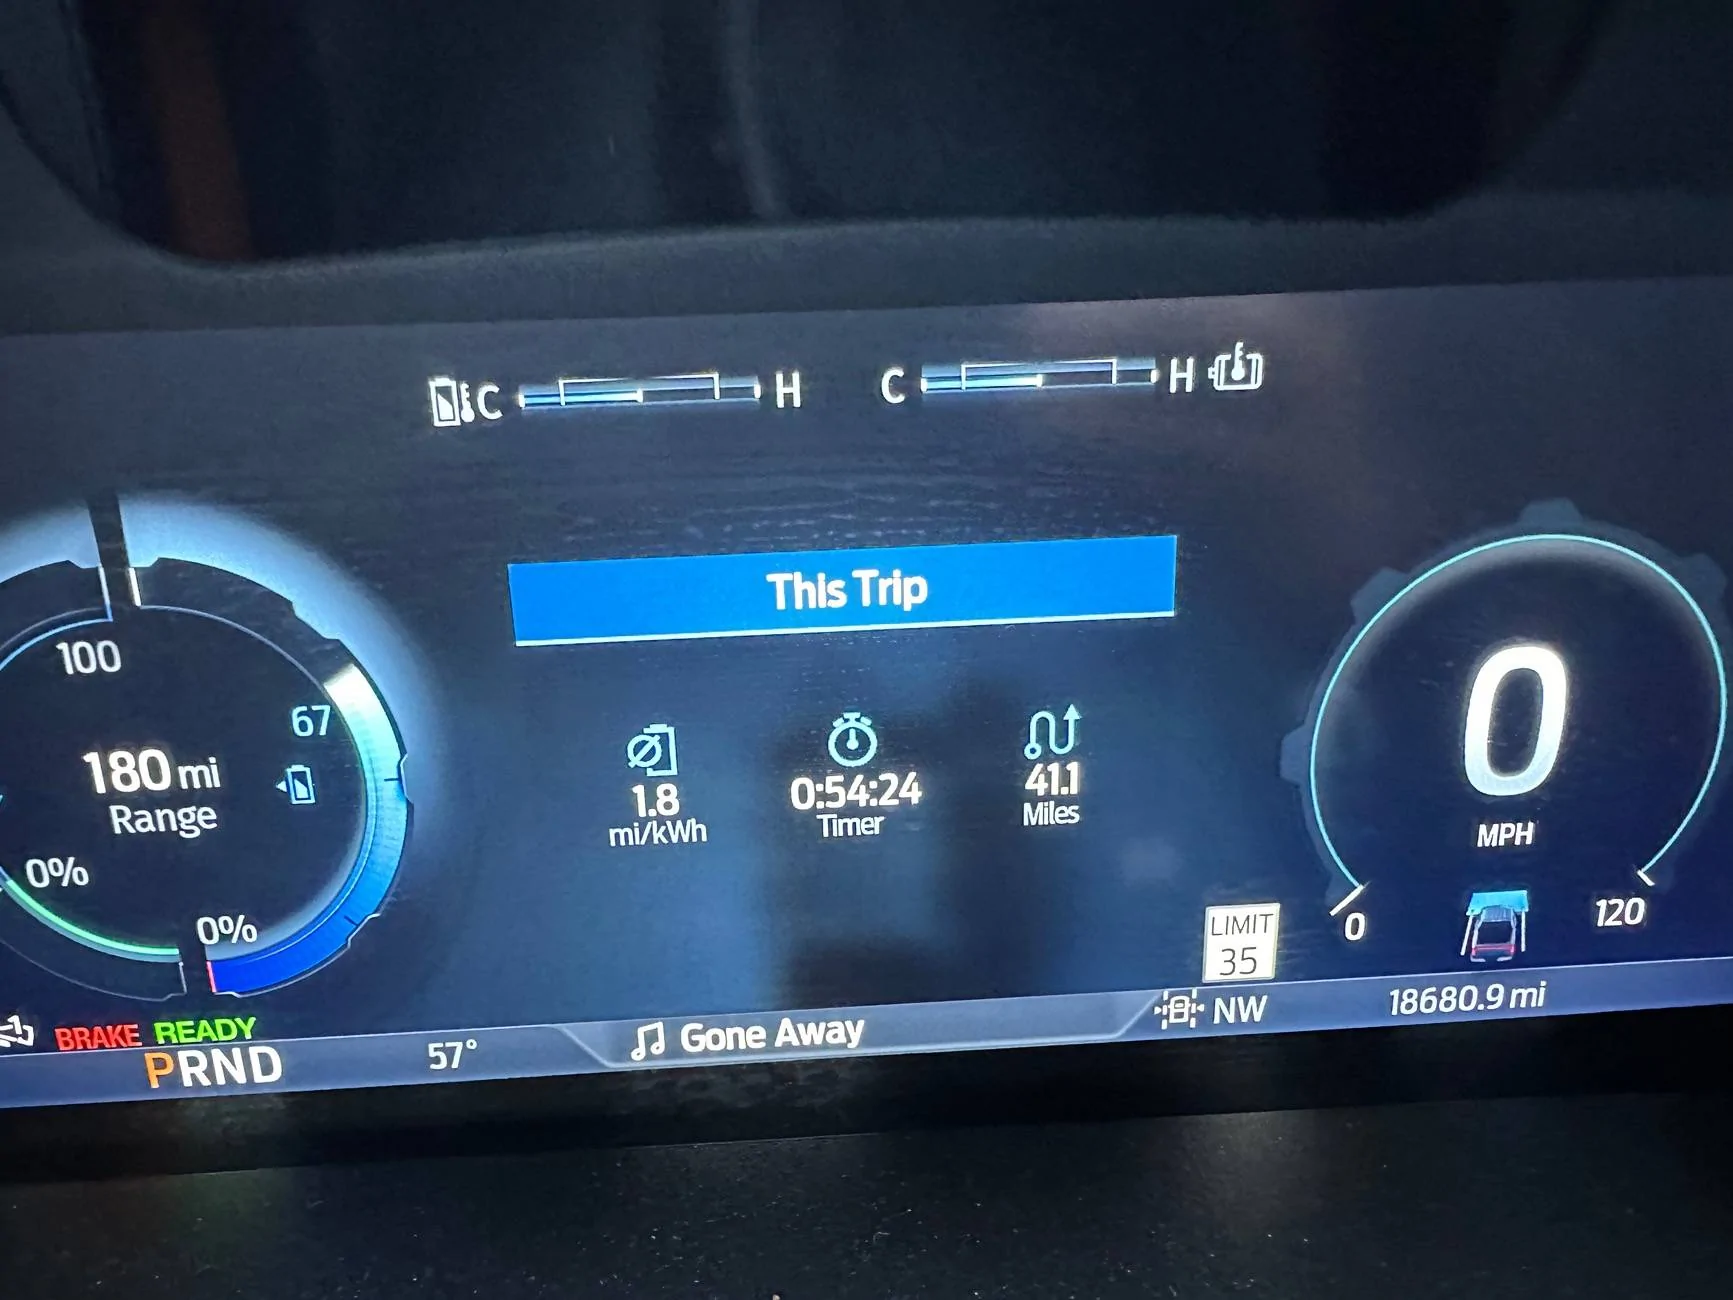
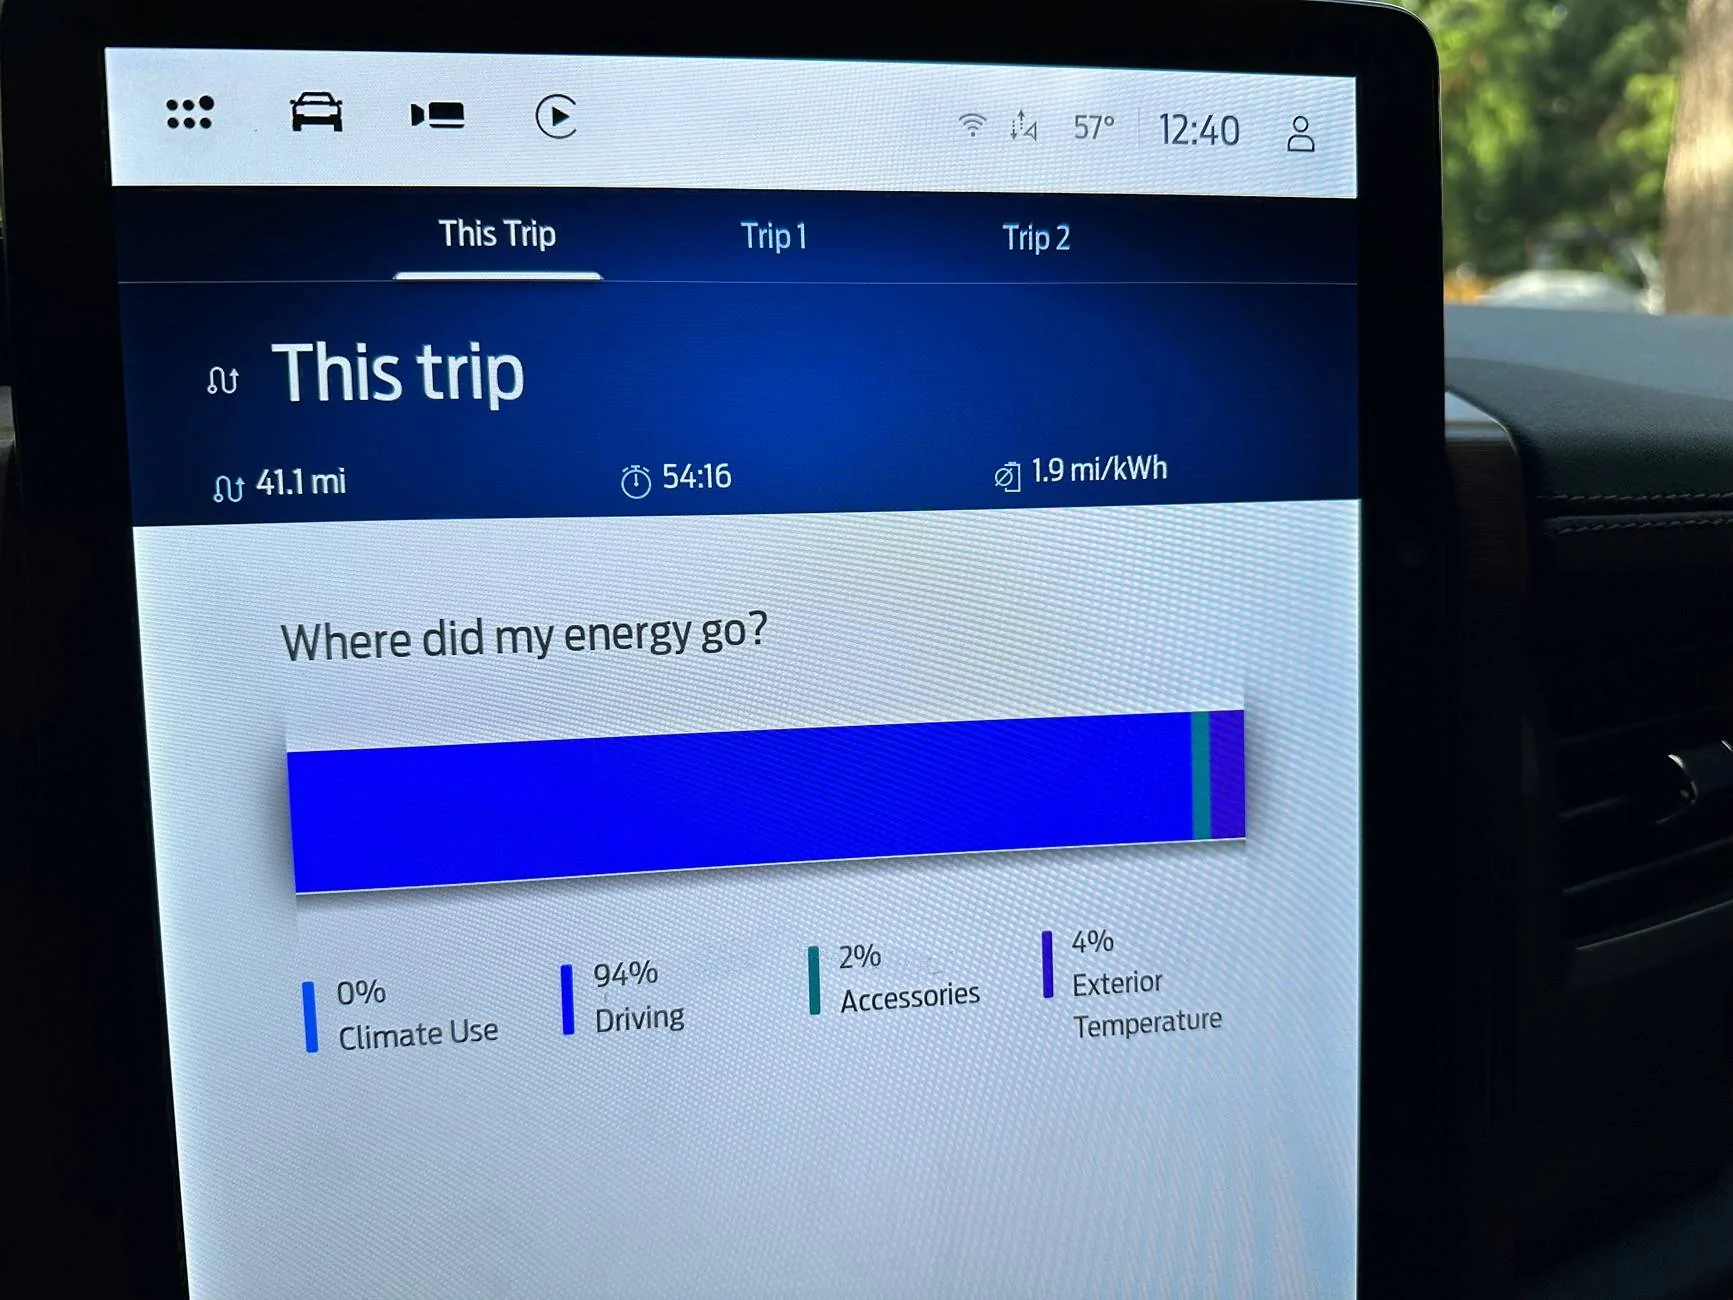
Something new I noticed on my commute today - differing displays and calculations for mi/kWh. I do not use the GOM for anything and usually do the math when driving long distances. I have noticed using my ODBII device the dash display is generally pessimistic on what it shows once I do the calculation post trip. I attributed it to rounding but why do different screens in the truck show different results? Has anyone else done a deeper dive into specifics on this using data for measurements? If so, please provide results. That extra ~.1 or .15 mi/kHw might help change charging locations when traveling.

IMG_9272.jpeg
IMG_9273.jpeg


IMG_9270.jpeg
IMG_9269.jpeg
I have only noticed a .1 mi/kWh difference between the dash and iPad screens! Do others see more than this difference?
 

TaxmanHog

Moderator
Moderator
First Name
Noel
Joined
Jan 19, 2022
Threads
171
Messages
12,341
Reaction score
13,004
Location
SE. Mass.
Vehicles
2022 Lightning Lariat-ER Max Tow & 2024 Harley-Davidson Road Glide CVO-ST
Occupation
Retired
I have only noticed a .1 mi/kWh difference between the dash and iPad screens! Do others see more than this difference?
No, many of us have observed the 0.1 discrepancy
 

Scorpio3d

Well-known member
First Name
Chris
Joined
Mar 18, 2024
Threads
19
Messages
563
Reaction score
637
Location
Texas
Vehicles
2023 Ford F150 Lightning Lariat ER
Occupation
SS/IBA car wash owner
I like your "Bob" and "John" analogy. As an IT professional, my guess is that both screens are using the same data point, but for the display value the center screen Bob is rounding (1.87 becomes 1.9) while in the driver display John is truncating (1.87 becomes 1.8).

Still very annoying to those of us with moderate to severe OCD.
If you truly had OCD, you would call it CDO!:wink:
Sponsored


Top